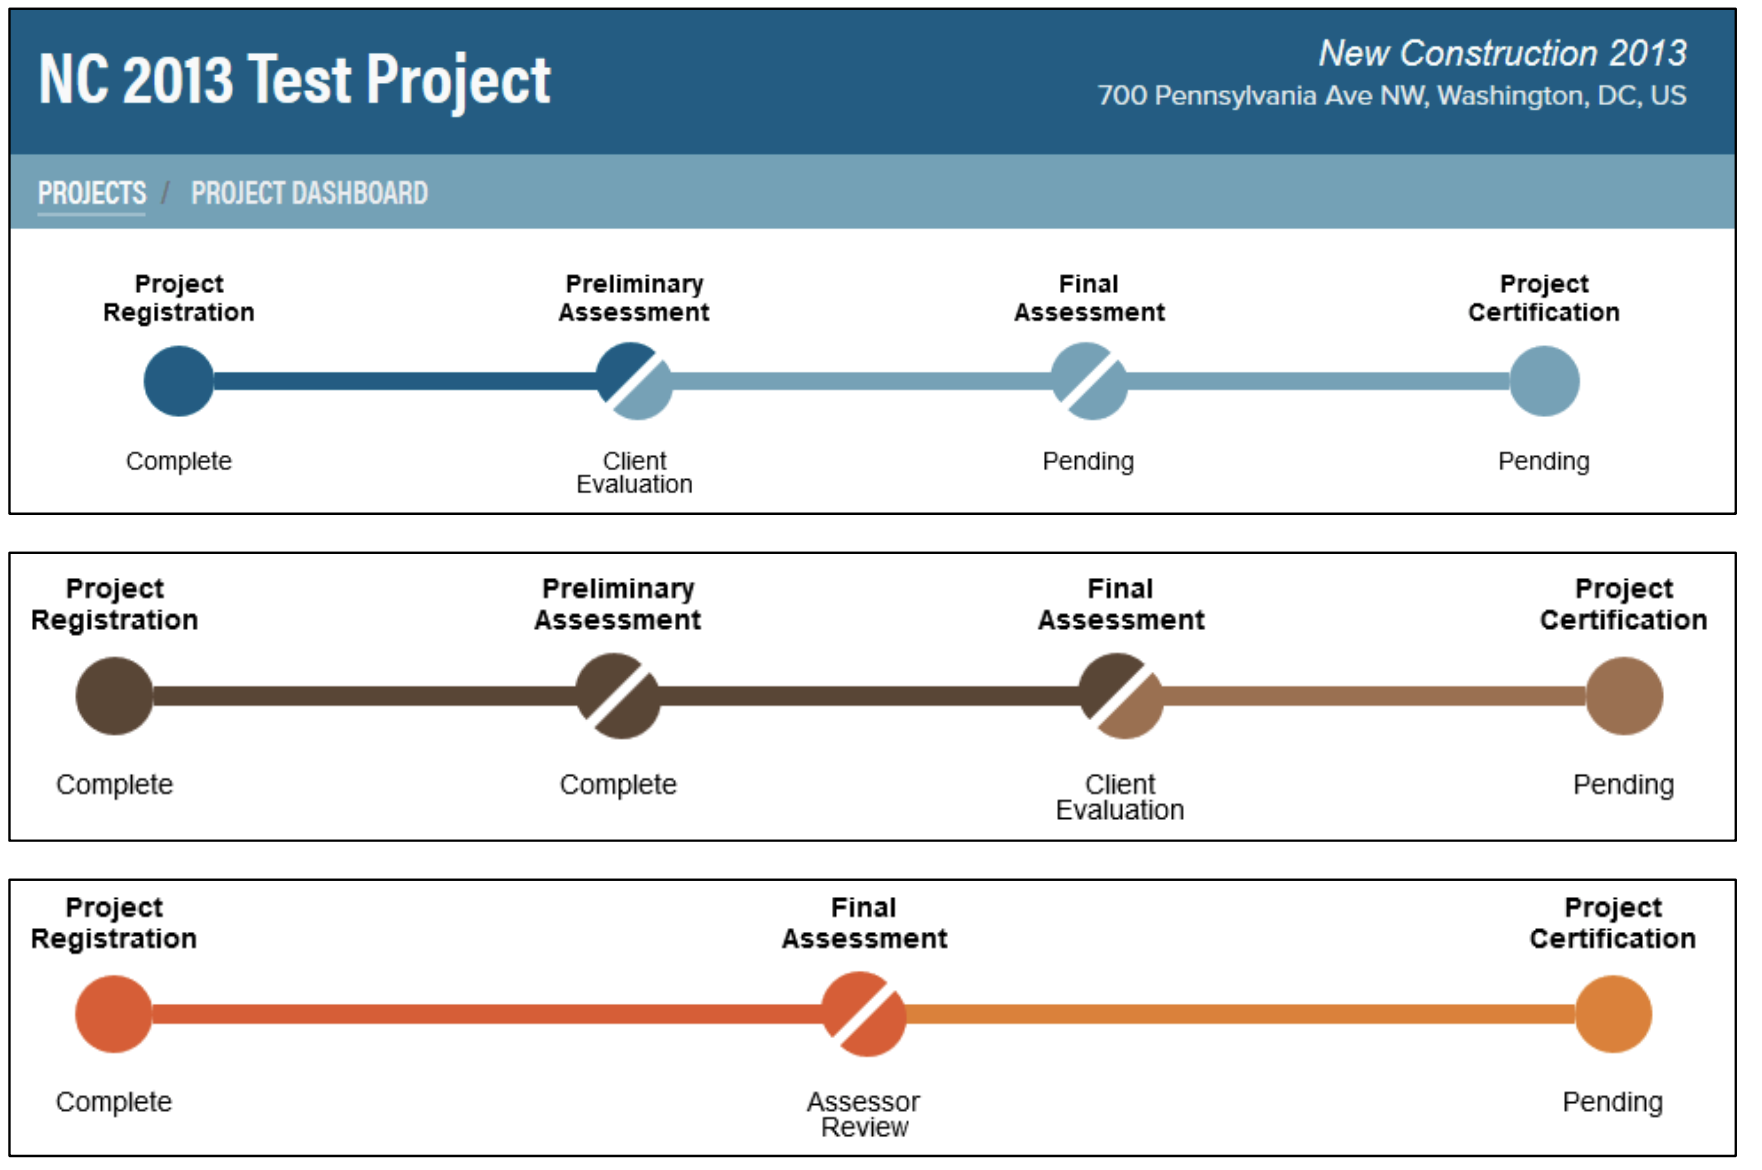
The first page you see when launching your Green Globes project is the Project Dashboard. The header and timeline are color-coded by program using the GBI branding: blue for NC, coral for EB, and brown for SI.
Click "Projects" in the breadcrumb trail to navigate back to the Green Globes project list in your GBI Account.
The Project Timeline shows the quantity of assessments and the current status.
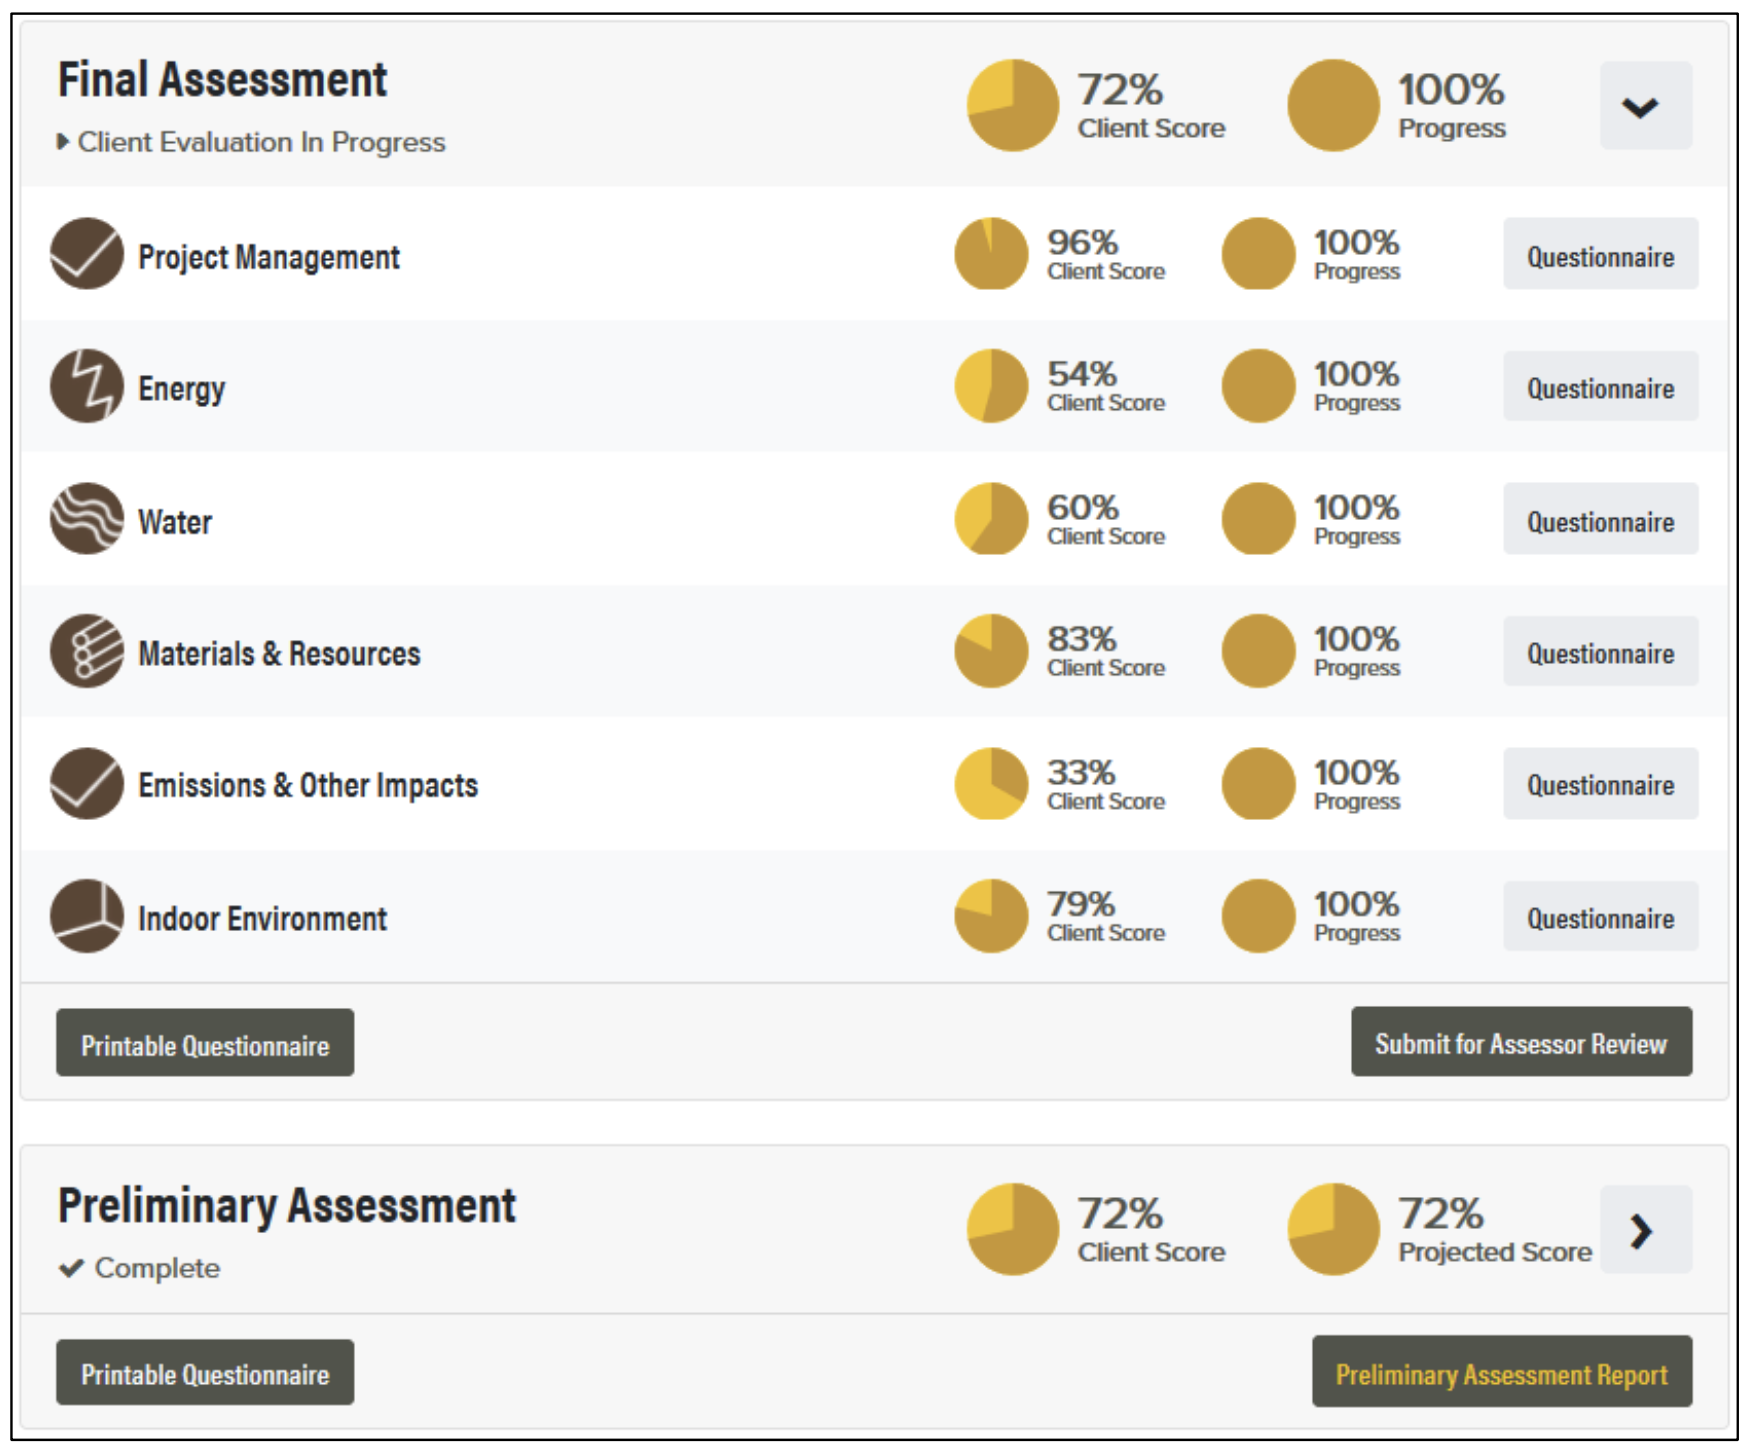
The Dashboard is arranged in tiles, which can be expanded and collapsed depending on your viewing preference. There is one tile for each assessment with the most recent assessment on top. When an assessment is complete, a tile for the next assessment will appear and be open for editing. At the bottom of each tile is a button to access the Printable Questionnaire (see Printable Questionnaire section below for details) and another button to submit the assessment for assessor review (if the assessment is in Client Evaluation) or view the Assessment Report (if the assessment is complete).
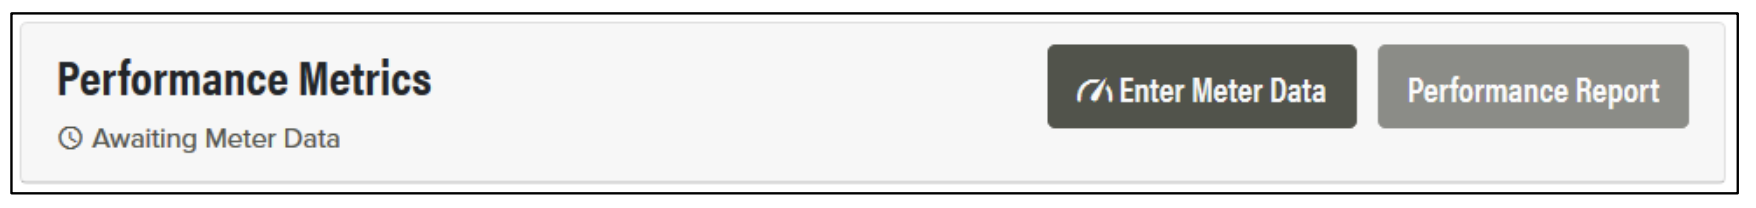
There is also a tile for Performance Metrics. (See Performance Metrics section below for details.)
At the bottom of the dashboard, there are buttons to edit the project details, access the Technical Reference Manual, and manage the project supporting documentation (see Manage Documents section below for details).
